Charlton School

Destination Data is used to measure the impact of careers guidance for our students and to help us improve outcomes for our young people.  Additionally, it is used to track trends over time to ensure the appropriate up-to-date guidance is given from years 7 to 11.

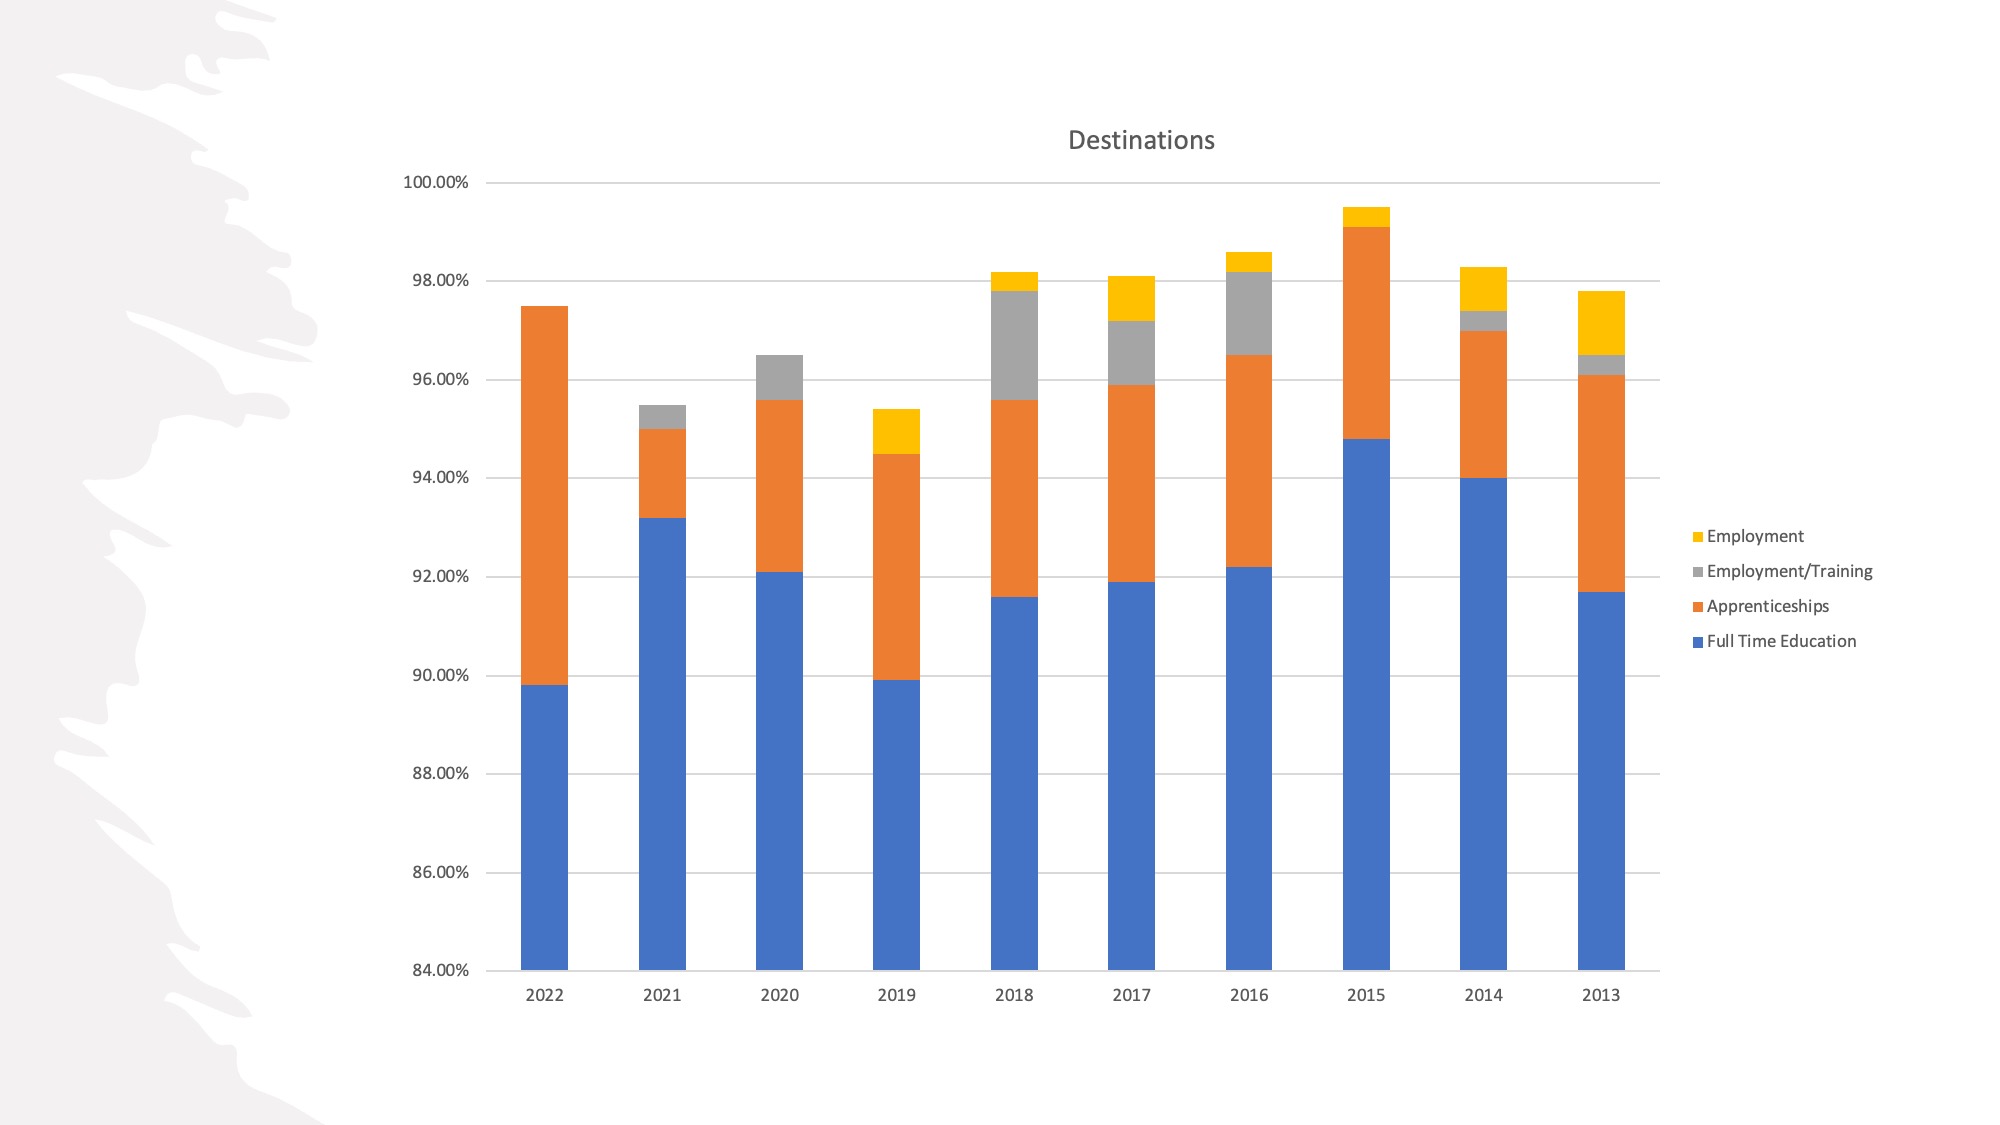
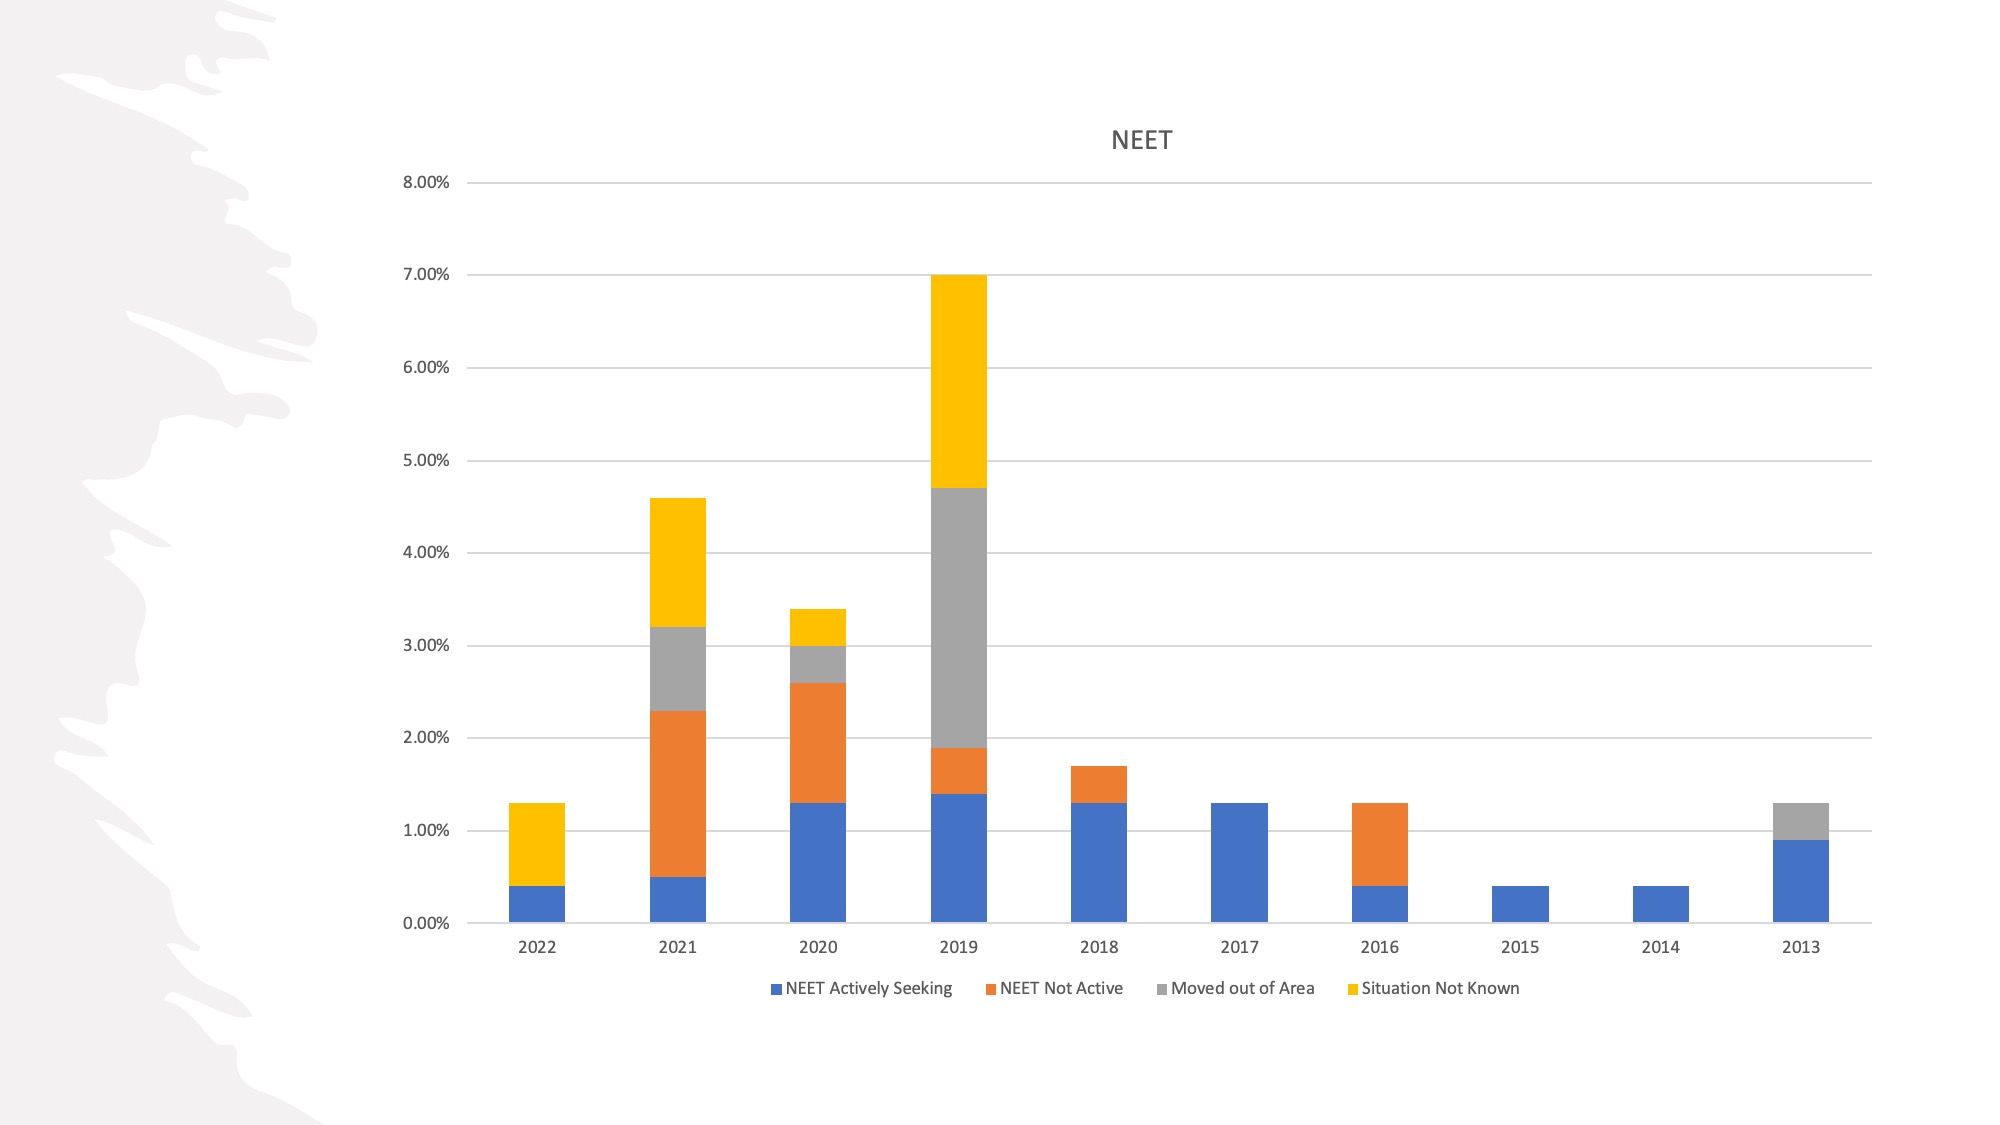
The bar charts have been created as a percentage to track the movement of our students since 2013.

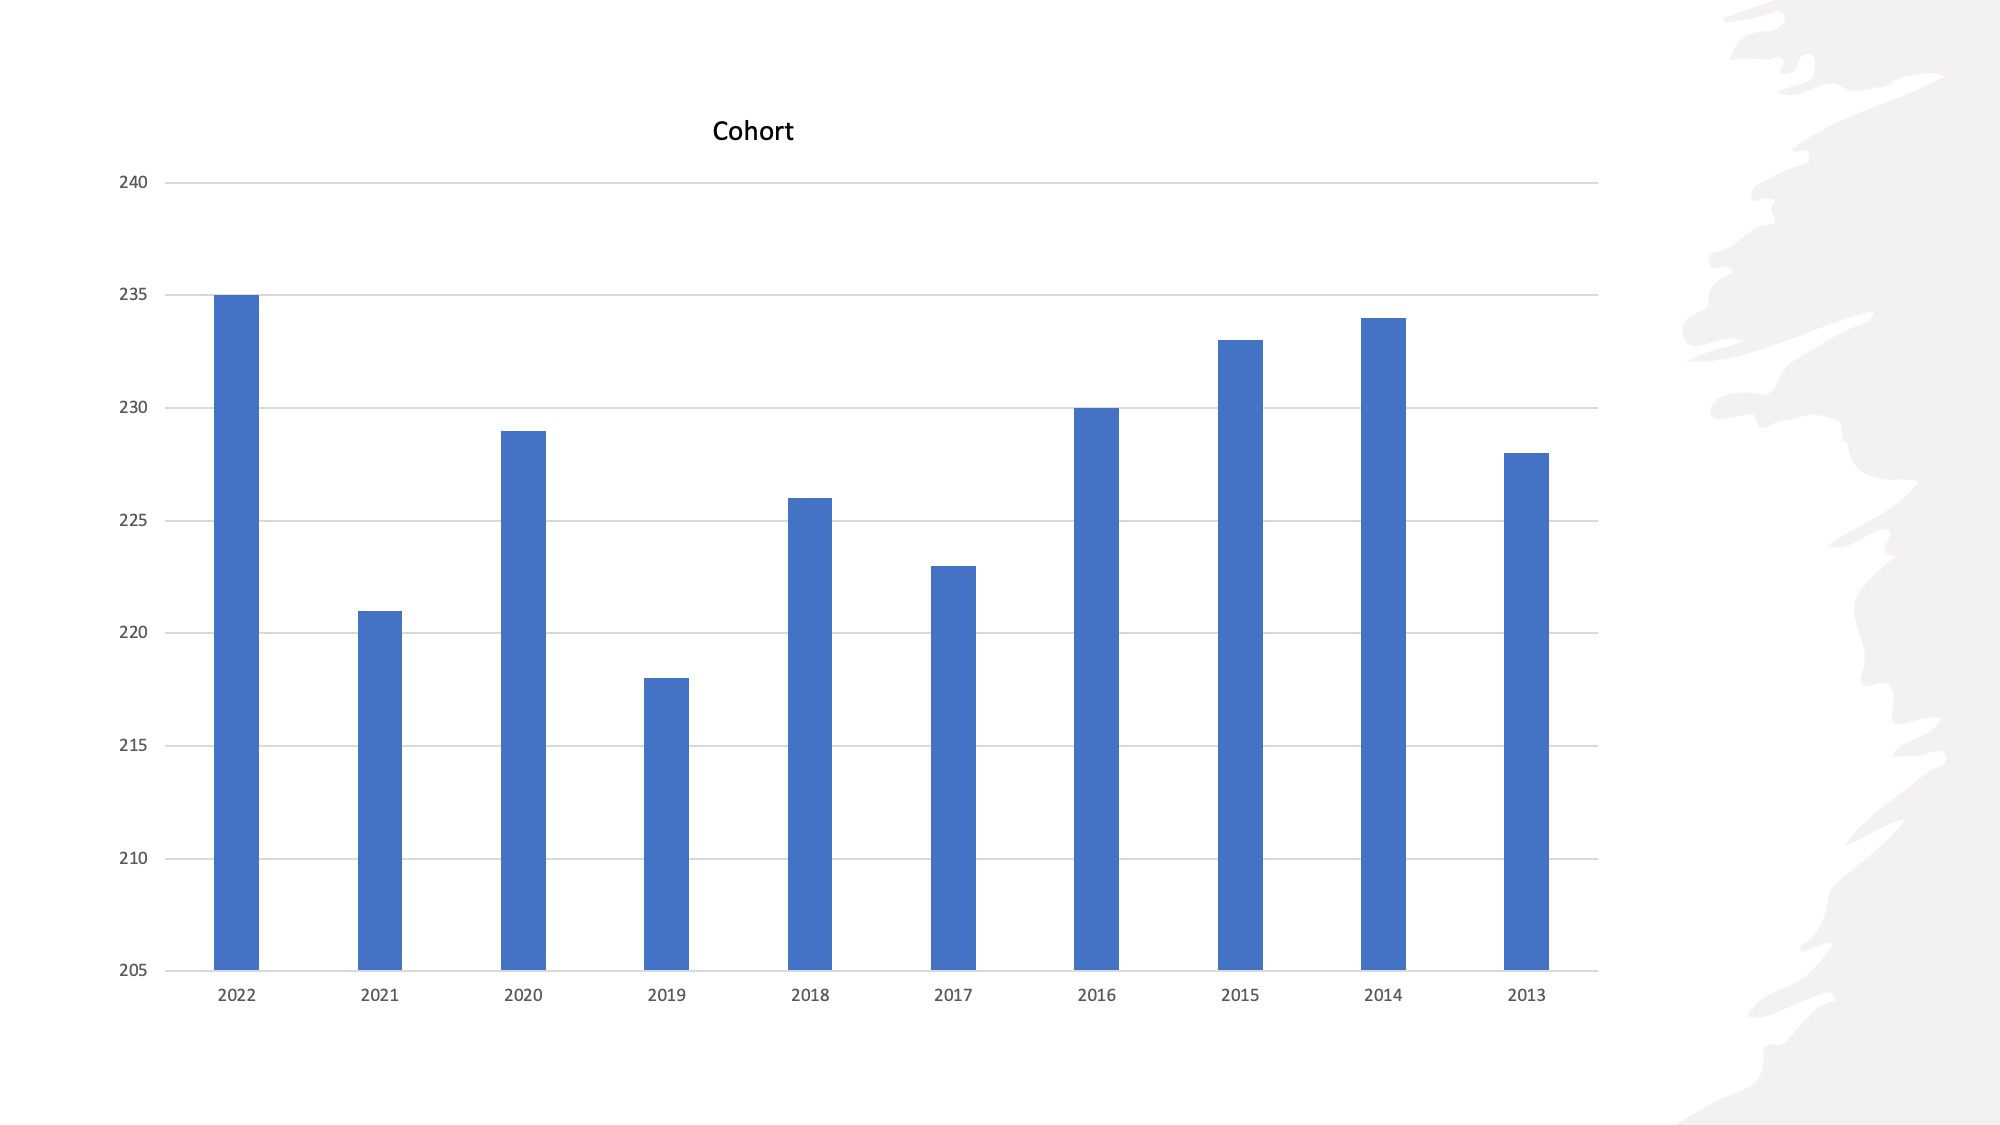
Student figures for each year:

Destination

2022

2021

2020

2019

2018

2017

2016

2015

2014

2013

Full Time Education

89.8%

93.2%

92.1%

89.9%

91.6%

91.9%

92.2%

94.8%

94%

91.7%

Apprenticeships

7.7%

1.8%

3.5%

4.6%

4%

4%

4.3%

4.3%

3%

4.4%

Employment/Training

0%

0.5%

0.9%

0%

2.2%

1.3%

1.7%

0%

0.4%

0.4%

Employment

0%

0%

0%

0.9%

0.4%

0.9%

0.4%

0.4%

0.9%

1.3%

Re-engagement

1.3%

0%

0%

0%

0%

0%

0%

0%

0%

0%


NEET

2022

2021

2020

2019

2018

2017

2016

2015

2014

2013

NEET Actively Seeking

0.4%

0.5%

1.3%

1.4%

1.3%

1.3%

0.4%

0.4%

0.4%

0.9%

NEET Not Active

0%

1.8%

1.3%

0.5%

0.4%

0%

0.9%

0 %

0%

0%

Moved out of Area

0%

0.9%

0.4%

2.8%

0%

0%

0%

0%

0%

0.4%

Situation Not Known

0.9%

1.4%

0.4%

2.3%

0%

0%

0%

0%

0%

0%


Cohort

2022

2021

2020

2019

2018

2017

2016

2015

2014

2013


235

221

229

218

226

223

230

233

234

228